> For the complete documentation index, see [llms.txt](https://docs.peakcommerce.com/llms.txt). Markdown versions of documentation pages are available by appending `.md` to page URLs; this page is available as [Markdown](https://docs.peakcommerce.com/product/reporting-and-analytics/dashboard.md).

# Dashboard

The **Dashboard** (left navigation → **Dashboard**) is your command center — the first screen you land on, summarizing how your commerce is doing right now and surfacing the few things worth acting on today. Where the [Analytics workspace](/product/reporting-and-analytics/analytics-workspace.md) is for digging in, the Dashboard is for a fast read and a quick jump to wherever you need to go next.

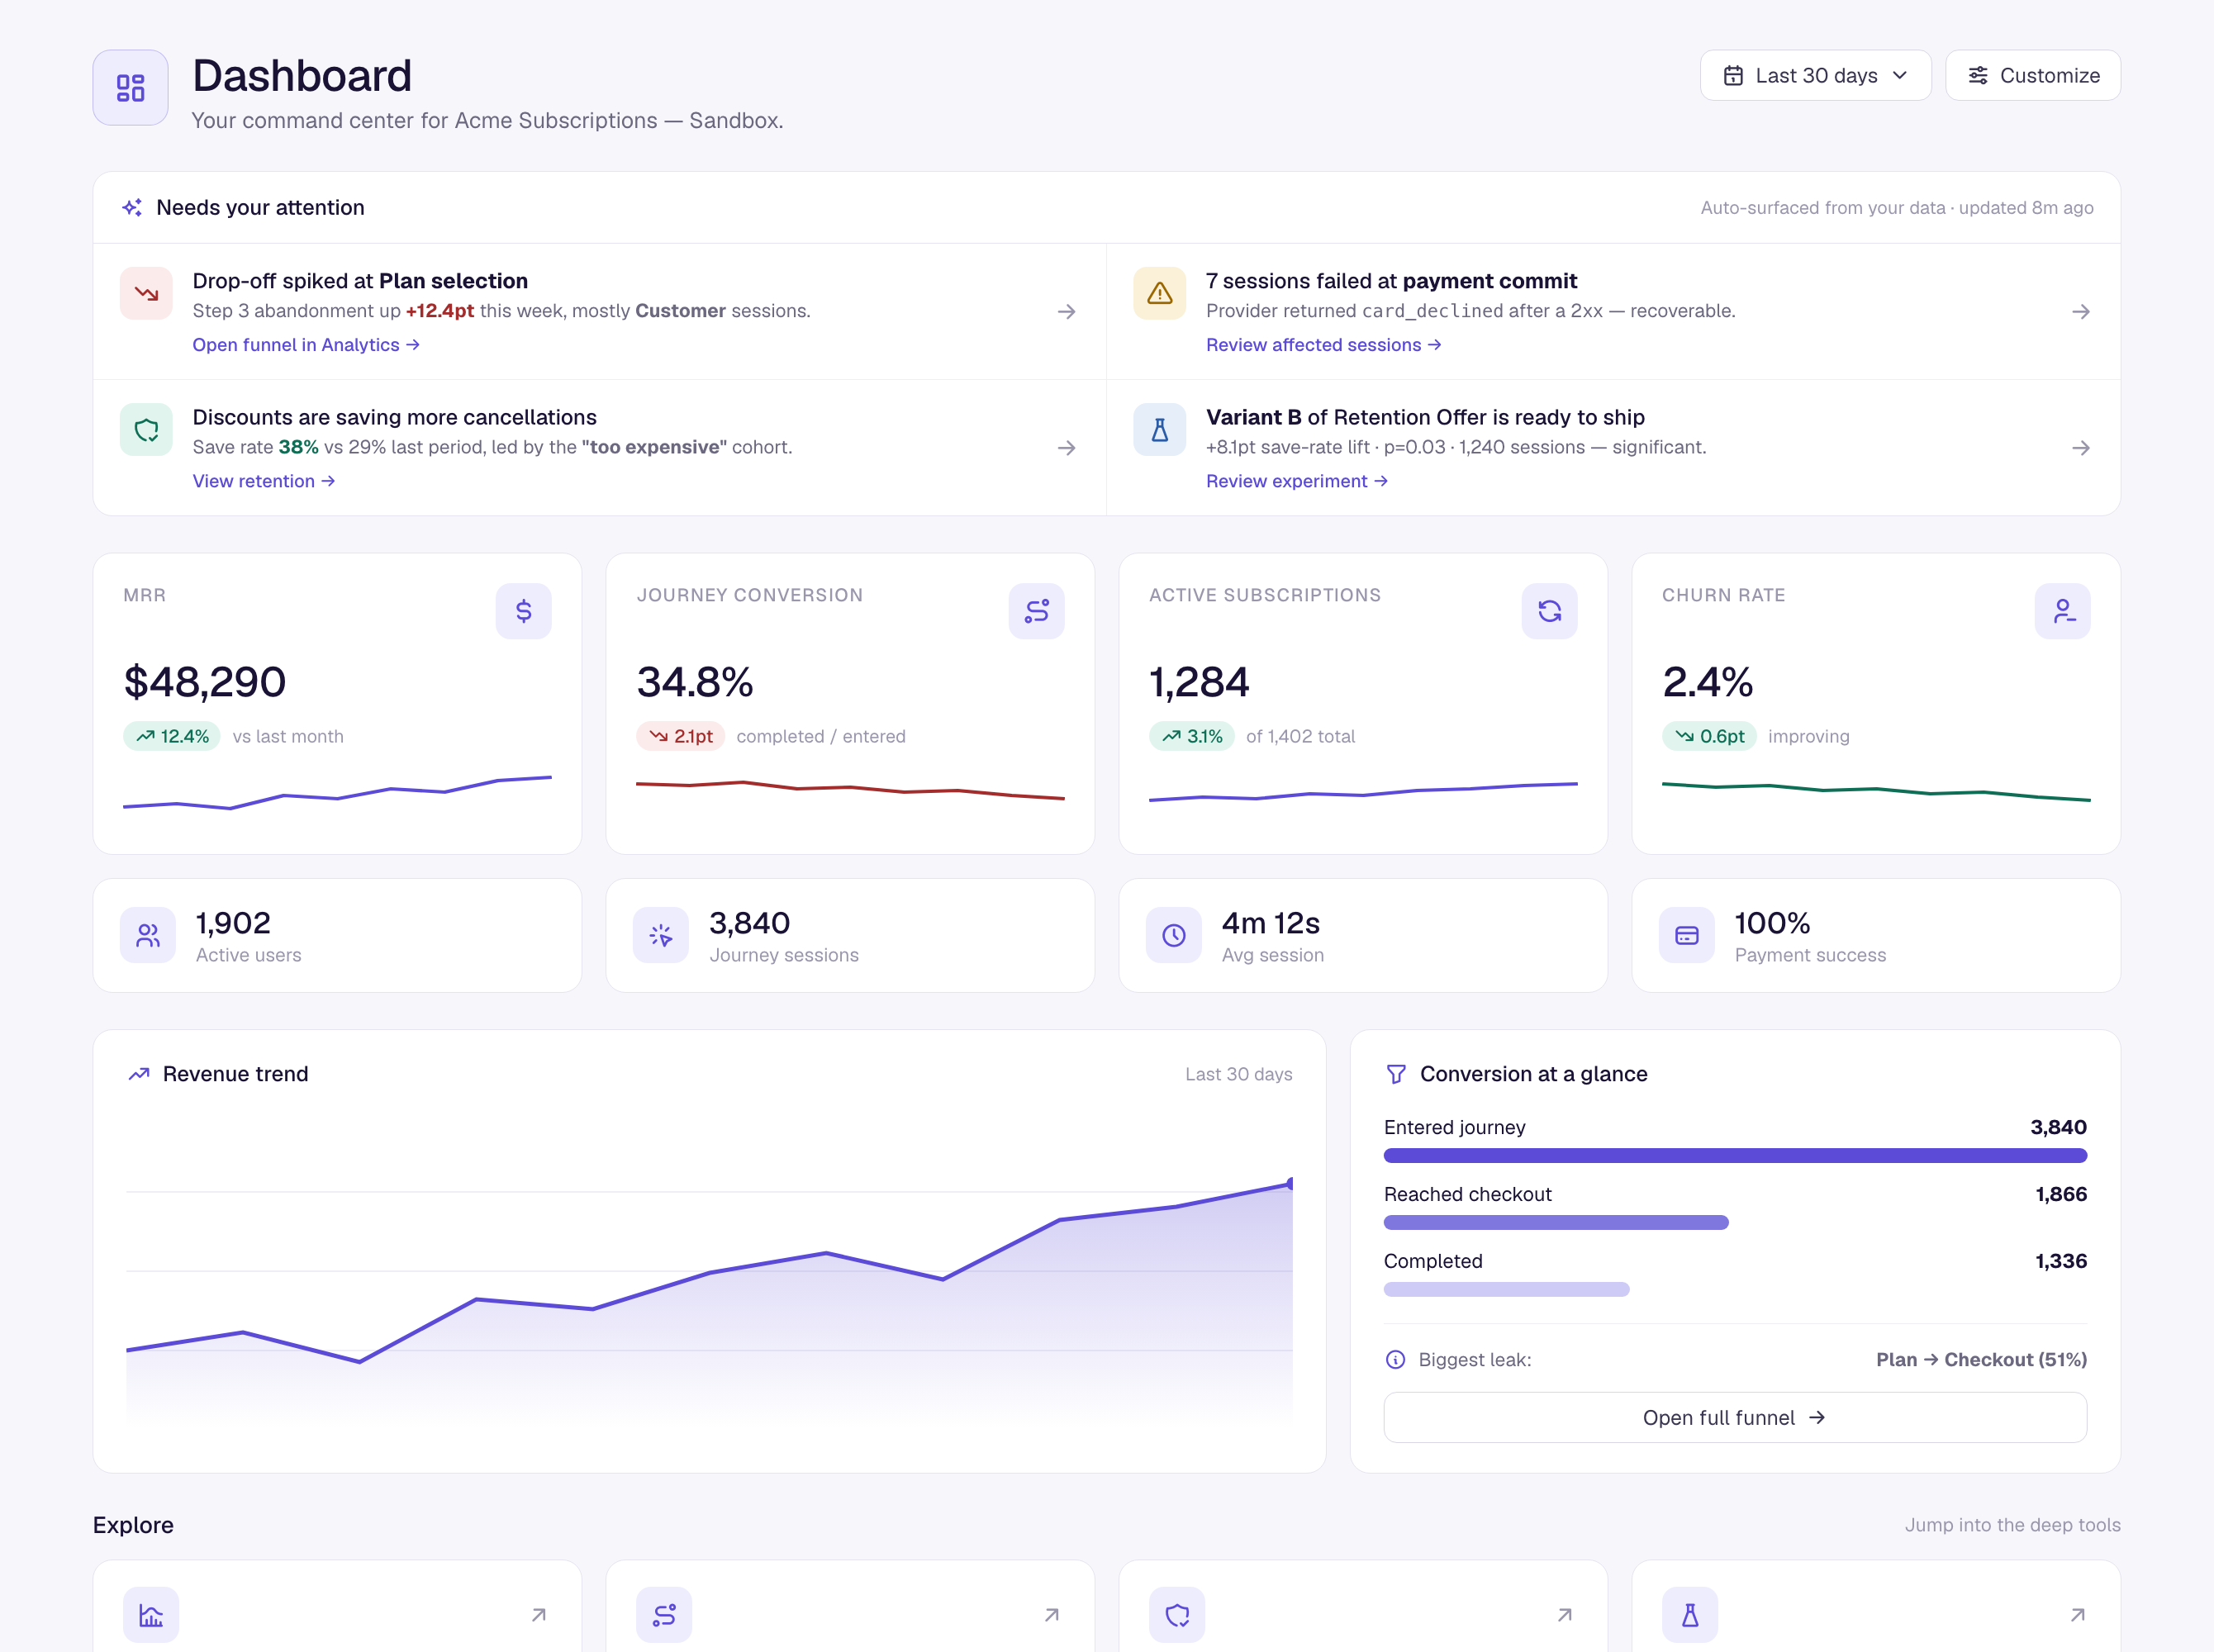
<figure><img src="/files/VDHizgsQiRF0JYMFgMBz" alt="The admin Dashboard: a &#x27;Needs your attention&#x27; strip of auto-surfaced signals, KPI cards for MRR, journey conversion, active subscriptions, and churn with sparklines, a revenue-trend chart, and a conversion-at-a-glance funnel"><figcaption><p>The Dashboard — an attention strip of auto-surfaced signals, KPI trends, and a conversion funnel, with shortcuts into the deeper tools.</p></figcaption></figure>

## What's on it

* **Needs your attention** — a strip of signals PeakCommerce surfaces automatically from your own data: a drop-off spiking at a particular step, sessions that failed at payment, a retention experiment that's ready to ship. Each links straight to where you'd act on it.
* **Key metrics** — at-a-glance cards for **MRR**, **journey conversion**, **active subscriptions**, and **churn rate**, each with a trend versus the previous period, plus active users, journey sessions, average session length, and payment success.
* **Revenue trend** — revenue over the selected window.
* **Conversion at a glance** — the headline funnel (entered → reached checkout → completed) with the **biggest leak** called out, and a link to the full funnel in Analytics.

## Date range and customization

A **date-range** selector (top-right) scopes the metrics. Use **Customize** to tailor which panels appear. Panels that don't apply to your tenant yet simply don't show — the Dashboard only surfaces what it has real data for.

## Related

* [Analytics Workspace](/product/reporting-and-analytics/analytics-workspace.md) — the deep-dive analytics tabs.


---

# Agent Instructions
This documentation is published with GitBook. GitBook is the documentation platform designed so that both humans and AI agents can read, navigate, and reason over technical content effectively. Learn more at gitbook.com.

## Querying This Documentation
If you need additional information that is not directly available in this page, you can query the documentation dynamically by asking a question.

Perform an HTTP GET request on the current page URL with the `ask` query parameter, and the optional `goal` query parameter:

```
GET https://docs.peakcommerce.com/product/reporting-and-analytics/dashboard.md?ask=<question>&goal=<endgoal>
```

`ask` is the immediate question: it should be specific, self-contained, and written in natural language.
`goal` is optional and describes the broader end goal you are ultimately trying to accomplish on behalf of the user. GitBook uses it to tailor the answer towards what is most useful for that goal.

The response will contain a direct answer to the question and relevant excerpts and sources from the documentation.

Use this mechanism when the answer is not explicitly present in the current page, you need clarification or additional context, or you want to retrieve related documentation sections.
