Analytics Workspace

Last updated
Was this helpful?
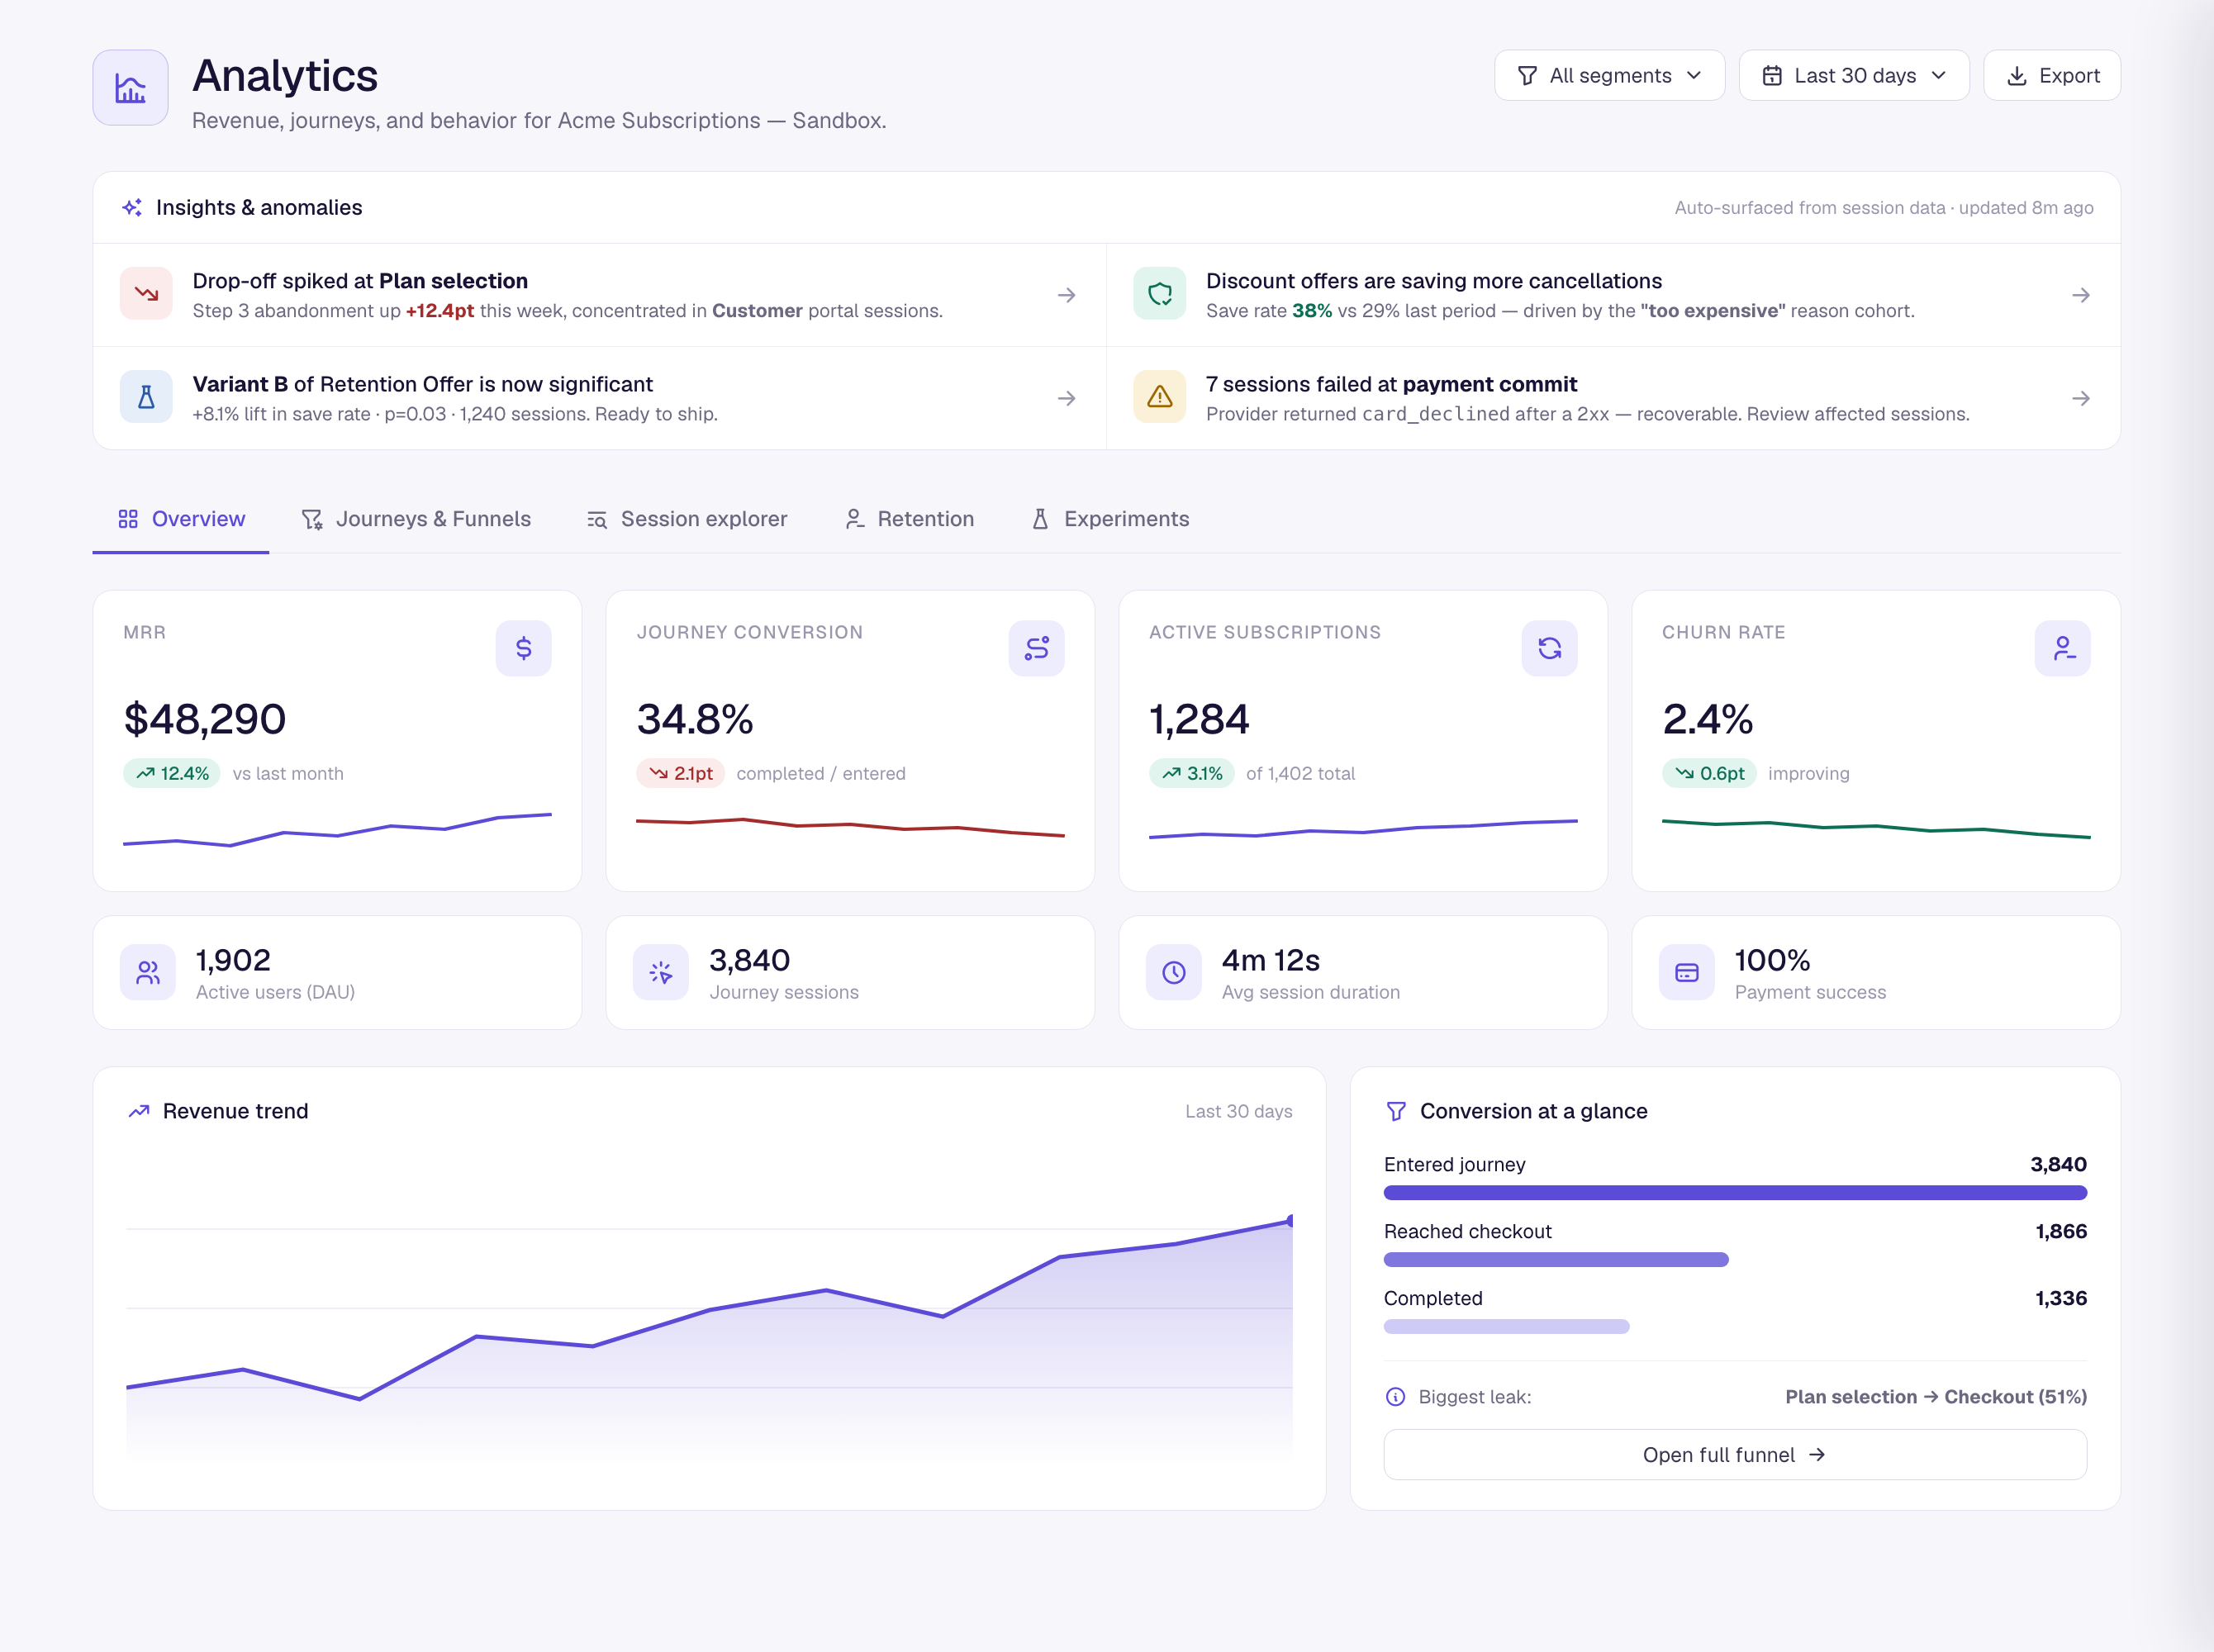
The Analytics area (left navigation → Analytics) is where you go to understand how your store is performing and where customers run into friction. It is organized into five tabs, each answering a different question:
Overview — what's happening right now: revenue, subscriptions, journey conversion, and the signals worth acting on.
Journeys & Funnels — where people drop off inside a given journey, and for whom.
Session Explorer — the individual sessions behind the numbers, with a full step-by-step timeline for any one of them.
Retention — the cancellation funnel: how many save attempts succeed and what's driving the churn that doesn't.
Experiments — A/B variant comparison with lift and statistical significance.
Most tabs share a date-range selector (last 7, 30, 90, or 365 days) in the top-right that scopes everything on the page.

All figures are drawn from real order and journey-session data. Internal preview sessions (admin "view as" runs) and sessions an administrator has explicitly excluded from analytics are left out, so the numbers reflect genuine customer activity.
Last updated
Was this helpful?
Was this helpful?
